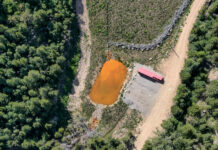
Decades later, abandoned mines continue to haunt Colorado’s waterways
According to a 2017 study, there are over 23,000 abandoned mines across Colorado and 1,800 miles of streams that are impaired due to pollutants related to acid mine drainage.
Some Western cities offer residents “cash for grass” to reduce irrigation
A study in 2016 showed that lawns are the largest irrigated crop in America.
Does cloud seeding work? Scientists watch ice crystals grow inside clouds to find out
Cloud seeding occurs in more than 50 countries, but we still don’t know whether it works.
Building a network for water journalism
The Water Desk is building a collaborative network of media outlets that cross-publish content related to Western water issues.
Members will be encouraged to share content, promote one another’s...
Photos: Front Range aerials, May 2019
This photo gallery features images shot during a Lighthawk aerial tour of water-related sites along Colorado's Front Range.
After departing from Rocky Mountain Metropolitan Airport in Broomfield, the flight...
A dry subject: how scientists map drought conditions
Scientists have a variety of measures of drought, but some are starting to use the term "aridification" to describe the long-term drying of the Southwest.
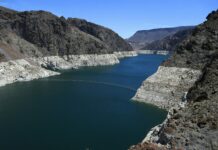
Western states buy time with a 7-year Colorado River drought plan, but face a...
The Drought Contingency Plan for the Colorado River is a historic agreement but it has some serious shortcomings.
Climate change will mean more multiyear snow droughts in the West
Ifclimate change continues relatively unabated, consecutive years with snow drought conditions will become much more common, with impacts on cities, agriculture, forests, wildlife and winter sports.
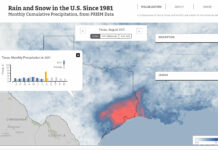
Map: monthly average precipitation
This map shows total rain and snowfall in the contiguous United States, every month from 1981 to the present. The map's color scale runs from white (no precipitation), to blue (significant precipitation) to red (intense...
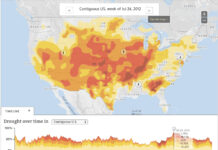
Map: weekly drought reports
This map depicts data from the National Drought Mitigation Center. Drought intensity categories are based on numerous indicators and local reports from more than 350 expert observers around the...


