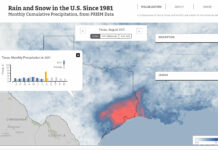
Map: monthly average precipitation
This map shows total rain and snowfall in the contiguous United States, every month from 1981 to the present. The map's color scale runs from white (no precipitation), to blue (significant precipitation) to red (intense...
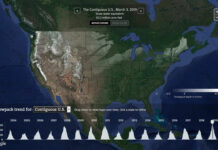
Map: daily nationwide snowpack
This map shows daily snowpack estimates for the contiguous United States since October 2003. Using the dropdown menu above the chart – or clicking a state on the map...


