Staging version updated 12/5/2023

An initiative of the Center for Environmental Journalism at the University of Colorado Boulder

Home Blog Page 51

Many U.S. reservoirs could be rendered useless by sedimentation

We’ve heard about the deteriorating status of American infrastructure and most imagine crumbling bridges and potholed roads. But there’s another looming infrastructure crisis that’s getting little to no attention—and it will eventually impact everyone: America’s reservoirs are filling up with sediment. Their storage capacity peaked in the 1980s and it’s been going downhill ever since—sometimes with disastrous consequences.

Lewis and Clark Lake
Lewis and Clark Lake is the reservoir created by Gavins Point Dam on the Missouri River. It’s 30 percent full of sediment and could be half full by 2045. | Photo (taken in 2011): Missouri Sedimentation Action Coalition

Niobrara, Neb.— Ruth Janak regularly walks along the Missouri River’s edge in the small town of Niobrara, Nebraska, where she lives. She’ll pan the landscape—hoping to find any remnant of the inventory from the service station she ran with her husband, Victor. Remarkably, she finds things—a hydraulic hose, a belt—but there’s a lot that’s missing—workbenches, tires, cabinets, a pop cooler. It’s gone. “Where are they?” she asks, knowing there’s no answer.

When the “bomb cyclone” weather event ravaged areas from Colorado to Nebraska and the Dakotas last spring, the Spencer Dam on the Niobrara River failed, sending not only a wall of water, debris, and sand downstream but also huge chunks of ice as big as bulldozers. Like a battering ram the flow shoved everything into the river from propane tanks to cattle—and unfortunately for the Janaks—their business.

Standing in a new location higher up in town where they’ve recently moved, Ruth pulls out her phone and shows a video taken by an employee of the Nebraska Department of Transportation, which shows buildings helplessly surrendering to the ice-filled, brown, churning waves and untethering from their foundations, passing treetops as they float out of view.

“The craziest part about it,” she says, “is that our business wasn’t in the floodplain,” adding quickly, “but I’m sure that’s going to change.” It’s a sober recognition that the epic storm will not only likely shift the demarcation for flood hazards—but also be the boundary she’ll remember between her old life and new.

The Janaks weren’t in the floodplain—technically that is—but changes to Missouri River since the last century have blurred the lines of where the government says water officially goes and why. Huge amounts of sand and silt have been accumulating in the river—especially near where the Janak’s business sat at the confluence of the Niobrara and the Missouri Rivers. The more sediment piles up there, the higher the waters rise—something Ruth has witnessed firsthand. When she and Victor bought their business, the water wasn’t even close to them. With increasing siltation, she says, “It knocks at your back door all the time.”

The Country Cafe in Niobrara, Nebraska, was buried in ice during the flood of March 14, 2019.

Clear as mud

Sedimentation occurs when all the sand, silt, rocks, and soils that would naturally travel down rivers to the sea get trapped behind dams. Sediment itself is a good thing. It creates habitat, fertile farm fields, and forms deltas at the river’s mouth that are natural buffers against storms in places like Louisiana. But when dams were built along the Missouri River, that natural process came to an end and the troubles began.

Perhaps nowhere is sedimentation more evident than at the confluence of the Niobrara and Missouri Rivers, where the water snakes its way through lumps of grass-covered islands. The sand has piled up there ever since the completion of the Gavins Point Dam just downstream. When the sediment-laden river hits the deep standing water of its reservoir, called Lewis and Clark Lake, the water loses its energy and the load it’s carrying drops out.

90,000 dams

Over time, the sediment mounds up to form a delta and the river is forced to go over, around, or even under it. That happens rain or shine, but during a major flood disaster, like the recent bomb cyclone, levels are pushed up proportionately, if not higher—a point the catastrophic flooding from the Spencer Dam failure made all too clear, says Nicholas Pinter, professor of earth and planetary sciences at the University of California, Davis. He says that sedimentation caused by Gavins Point Dam made the destruction of the Janak’s property more likely—“absolutely, unquestionably—and no honest person in the Corps or otherwise would say not.”

The “Corps” he’s referring to is the Army Corps of Engineers. They built Gavins Point Dam in 1955, but in the 1970s they had to move the town of Niobrara because sedimentation resulting from the dam’s reservoir was raising the water table, causing flooded basements and ruined crops.

HistoryNebraska_NiobraraMove3

Actually, the town of Niobrara had to be physically moved—twice. The first time was in 1881 when an ice jam on the Missouri flooded the village with nearly six feet of water. The townsfolk pulled its buildings by oxen and mule a mile-and-a-half to higher ground where they thought they would be safe. But that was before Gavins Point Dam was built.

No one disputes that the reservoir was responsible for the high groundwater in Niobrara in the 1970s. In fact, the engineers who built the dams in the 1940s and ’50s along the Missouri River knew sedimentation would be a consequence. But, says Pinter, Gavins Point Dam was “designed as almost every large dam on Earth, which is not to say that it was well designed or poorly designed, but it was well known at the time that it would not pass the sediment that it would need to, to avoid this problem.”

A sediment design life

The fact that the dams would not pass sediment—and that eventually sedimentation would make them inoperable—was not only fully acknowledged by the engineers who designed them, but they even had a name for it—the “Sediment Design Life.” As Tim Randle, Manager of the Sedimentation and River Hydraulics Group at the Bureau of Reclamation explains, “Virtually all reservoirs in the U.S. and much the world were designed with a sediment design life, meaning after so much time the reservoir’s not going to function very well, the outlet will be plugged.” For Reclamation and Army Corps dams, he says, that lifespan was somewhere around 100 years.

Sedimentation Diagram

Since many large dams were built in the middle of the last century, they are now in the second half of their sediment design life. Some might fill in decades, others in hundreds—or even thousands of years. Which ones? That’s hard to know, says Randle. Most reservoirs—65 percent of Reclamation reservoirs—haven’t been surveyed for sedimentation since they were filled.

Randle says long before reservoirs completely fill there will start to be problems like dam outlets or hydropower intakes getting gummed up, as well as boat ramps or marinas getting buried—and as was the case in Niobrara—floods. There are over 90,000 dams on the federal inventory—so any notion of just letting the reservoirs fill up and store water elsewhere would be difficult—essentially all the good sites are taken.

The Pick-Sloan Plan…and the rest is history

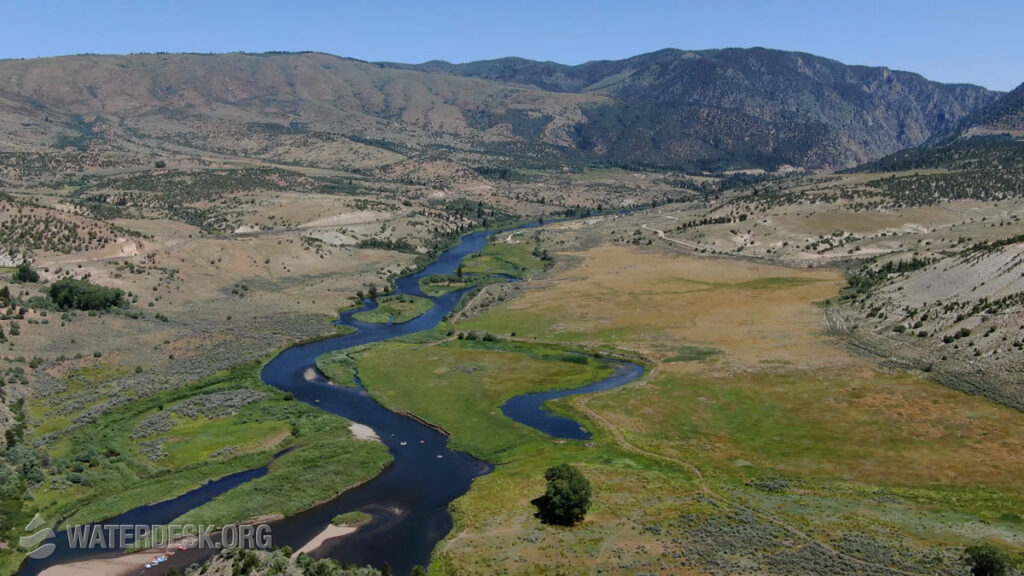
But history might have taken a different course had Glenn Sloan prevailed. Before the dams were built the sediment-laden “Big Muddy” meandered restlessly from valley wall to valley wall and flooded occasionally. When the Lewis and Clark expedition explored the Missouri River in the early 1800s it was almost a mile wide with numerous sandbars that split the waterway into several braided channels.

DeltaEvolution_GavinsPointDam_thumb

But in 1943, three devastating floods put pressure on Congress to tame the river once and for all, and they called on the Army Corps of Engineers to produce a plan. Colonel Lewis A. Pick, then division engineer in the Corps’ Omaha, Nebraska, office, proposed five multipurpose dams on the mainstem of the Missouri River above Sioux City, Iowa.

Meanwhile, William G. Sloan, an engineer with the Bureau of Reclamation, called for over 85 new tributary dams and three mainstem dams. Tim Cowman with South Dakota Geological Survey suggests that by putting smaller dams on the tributaries, they would have captured small amounts of silt and sediment in numerous places, preventing it from reaching the Missouri—and perhaps avoiding the massive sedimentation problem happening today.

In the end, the plans were merged into the Pick-Sloan Plan, which Congress ratified in the Flood Control Act of 1944. The plan brought flood control, irrigation, and hydropower to the basin, but Native Americans, whose reservations bordered the river, were huge losers. The reservoirs flooded their best agricultural and grazing lands and displaced hundreds of families. Attorney Peter Capossela, writes in his article, “Impacts of the Army Corps of Engineers’ Pick- Sloan Program on the Indian Tribes of the Missouri River Basin”:

Capossela

The trouble below

Meanwhile, the sediment delta of Lewis and Clark Lake grows. It extends, on average, 400 feet per year—and in huge weather events, storms can shove sand and silt nearly a mile into the lake. Cowman says this not only takes up precious storage space but also reduces the reservoir’s ability to handle floods.

The U.S. passed peak per capita capacity in the 1960s, according to the International Association for Hydro-Environment Engineering and Research.

But downstream of the dam, he says, there are problems, too. When water is released downriver, it’s clear, having left its trapped sediment in the reservoir. However, the released water actually seeks out sediment, something called “hungry water.” That water satisfies its craving by scouring the riverbed below and eroding its banks. In fact, Cowman says, the channel below Gavins Point has been eroded by ten feet, and that’s recently forced the city of Yankton, South Dakota, to lower its water intake pipes because they’ve become higher than the river’s surface. For comparison, according to the organization International Rivers, “Within nine years of the closure of Hoover Dam, hungry water had washed away more than 110 million cubic meters of material from the first 145 kilometers of riverbed below the dam, lowering it in places by more than four meters.“

Also because the dam controls the river flows—never getting too high, never too low—the natural process that used to build sandbars, stopped. Normally during flood events, Cowman says, high water builds up what are essentially sand dunes on the bottom of the riverbed. Once the water drops to normal levels, those sand dunes become sandbars sticking out of the water. Unless there are occasional high flows, new sandbars won’t form and the ones that are there will erode away. In fact the Army Corps of Engineers was required, at some expense, to build new sandbars because two endangered birds—the piping plover (Charadrius melodus) and interior least tern (Sterna antillarum athalassos)—that nest just below Gavins Point had lost their habitat.

Aerial for MSAC

Solutions

Because of these problems both above and below Gavins Point Dam, a group called the Missouri Sedimentation Action Coalition (MSAC) was formed to educate the public about the issue and find solutions before things get even worse. The group reflects a range of interests including individuals, nonprofits, cities, and tribes who are already feeling the effects of sedimentation in Lewis and Clark Lake, which is 30 percent full of sediment and expected to reach 50 percent by the year 2045 if nothing is done.

So what can be done? There are three general strategies to managing sediment in reservoirs. One is to look at the upstream watershed and reduce erosion and runoff to keep debris from entering the river. Tactics include bank stabilization efforts and buffer strips, to better farming practices and keeping livestock from grazing too close to a waterway.

Another set of solutions is to prevent sediment from depositing in the reservoir by routing the silt and sand through or around the dam. This can be achieved with tunnels or channels that bypass the sediment around the reservoir, or with sluicing methods that move sediment through the dam before it has a chance to deposit.

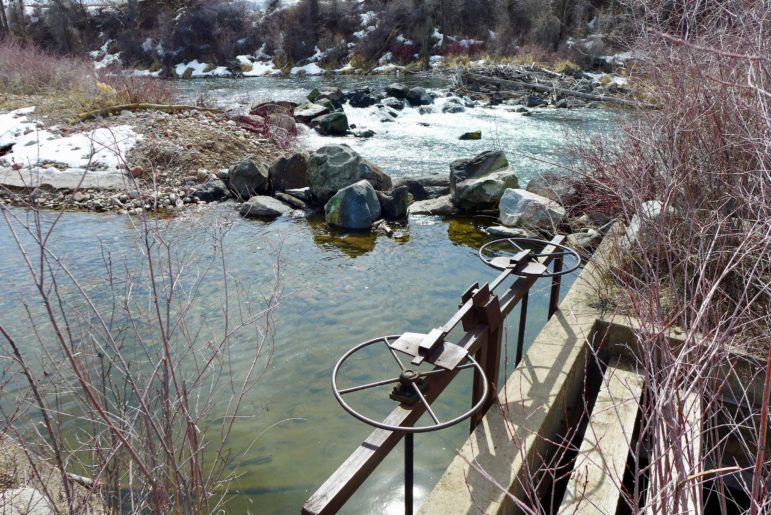
One mechanism that MSAC is evaluating is to create a sort of speed bump in the river channel with something called “sediment collectors,” which entails putting a metal trough (or a series of troughs) across the riverbed. The collectors would passively create a difference in the speed of the current as it passes over it and a substantial amount of sediment would drop into the trough, where it could then be augured out and up onto land. However, what to do with all that stockpiled sediment would be an issue.

The third approach is to remove sediment that has already been deposited in the reservoir either by dredging or flushing. The issue of what to do with all the material is also a question, particularly if contamination is suspected.

SOS

Any of the sediment management solutions will be costly, take time to implement, and have engineering challenges. Tim Randle and his colleagues are part of a group called the Subcommittee on Sedimentation, which ironically has the acronym “SOS.” In 2014 they put out a resolution [Full text] calling on all federal agencies that own or operate dams to come up with sustainable management plans for reservoirs by 2030 and that the plans “should include either the implementation of sustainable sediment-management practices or eventual retirement of the reservoir.” That was five years ago and not much has happened. [See June 2019 National Reservoir Sedimentation and Sustainability Team white paper.]

NRSST_SOS

Sedimentation is not just a problem for Niobrara, or even just the Missouri River. It threatens nearly every major reservoir in the U.S. And although what happened to the Janaks is in the extreme, it could be a harbinger of what’s to come if the issue is not addressed.

MSAC is adamant that doing nothing is not an option. Sandy Stockholm, executive director of the organization, says they are working with their stakeholders, the Army Corps, and several experts from academia with the goal to finalize the scope of a sedimentation management plan by the end of the year. The resulting plan—if they can fund and implement it—will not only slow the damage but also become a model for reservoirs across the country, which, whether dam owners know it or not, are on track to have the same fate. ?

This story originally appeared on H2ORadio.org and is republished here by permission.

The Water Desk’s mission is to increase the volume, depth and power of journalism connected to Western water issues. We’re an initiative of the Center for Environmental Journalism at the University of Colorado Boulder. The Water Desk launched in April 2019 with support from the Walton Family Foundation. We maintain a strict editorial firewall between our funders and our journalism. The Water Desk is seeking additional funding to build and sustain the initiative. Click here to donate.

Supporters say Proposition DD will ‘fund Colorado’s Water Plan,’ but what does that mean?

Lower Lincoln Creek. Photo by Brent Gardner-Smith/Aspen Journalism

By Heather Sackett

CARBONDALE — Proposition DD’s supporters — including environmental organizations, agriculture interests, conservation districts and Aspen Skiing Co. — say the measure will be used to close a $3 billion state funding gap in implementing the Colorado Water Plan. The frequently cited figure of a $100 million annual shortfall for 30 years is written in the water plan itself.

But where did the authors of the water plan get this number and what kinds of projects and programs might the measure fund? According to the legislation, money raised from Prop DD could go toward an agricultural water-use reduction program that doesn’t yet exist.

In the following explainer, Aspen Journalism unpacks the ballot question, which will be posed to voters Nov. 5, and what the tax revenue may actually end up funding.

The Colorado River in fall light. Proposition DD allows for tax revenue raised through sports betting to fund a future demand management program, which would pay agricultural water users to leave more water in the river. Photo by Brent Gardner-Smith/Aspen Journalism

How will Proposition DD work?

Gov. Jared Polis signed House Bill 19-1327 into law in May. But voters must still pass Proposition DD for it to take effect.

According to the 2019 State Ballot Information Booklet, Proposition DD would authorize the state to collect a 10% tax up to $29 million a year (but the projected average amount is $16 million) from casinos’ sports-betting proceeds. The Colorado Division of Gaming and the Colorado Limited Gaming Control Commission will be responsible for regulating sports betting operations.

Of the money raised, a projected $130,000 would go to gambling addiction services and $960,000 would go into a “hold harmless” fund. Entities that receive tax revenue from traditional gambling such as horse racing could apply for funding from the hold harmless fund if they can prove they lost money due to the legalization of sports betting.

The remaining projected average annual $14.9 million (but up to $27.2 million) in tax revenue would go to funding projects that align with the goals outlined in the water plan, as well as toward meeting interstate obligations such as the Colorado River Compact. Under the compact, the Upper Basin states, which include Colorado, must deliver 7.5 million acre-feet of water annually to Lake Powell.

If voters pass Proposition DD, it will take effect May 1.

Agricultural machinery in the Grand Valley, near Grand Junction. Photo by Brent Gardner-Smith/Aspen Journalism

What does the legislation say?

The legislation creates a special Water Plan Implementation Cash Fund, which would be administered by the Colorado Water Conservation Board, a statewide agency charged with managing Colorado’s water supply. The money could be spent on water-plan grants, but may also be spent “to ensure compliance with interstate water allocation compacts … including … compensation to water users for temporary and voluntary reductions in consumptive use.”

This language refers to a demand management program, the feasibility of which the state is currently studying.

A hayfield near Grand Junction, irrigated with water from the Colorado River. Under demand management pilot programs, the state could pay irrigators to fallow fields in an effort to leave more water in the river. Photo by Brent Gardner-Smith/Aspen Journalism

What is demand management?

At the heart of a demand-management program is a reduction in water use by agriculture on a voluntary, temporary and compensated basis, all in an effort to send up to 500,000 acre-feet of water downstream to bolster water levels in Lake Powell to meet potential obligations under the Colorado River Compact. Under pilot programs the state could pay ranchers and farmers to leave more water in the river.

The CWCB has formed nine workgroups, each tasked with helping to identify and solve issues related to demand management. Western Slope agricultural water users have expressed concern about how a demand-management program would be implemented fairly.

District 5 State Sen. Kerry Donovan, whose district includes Aspen and who was a sponsor of the bill, acknowledged that as Colorado gets a handle on demand management, money from Proposition DD could go toward funding a future program.

“Most water experts would say demand management in some form will be part of addressing the Colorado River Compact obligations,” Donovan said. “Maybe in five years, maybe in the next generation, but somewhere in the long-term planning strategy of the Colorado River, demand management will be part of the puzzle.”

District 5 State Sen. Kerry Donovan, left, speaks on a panel with other lawmakers at the Colorado Water Congress legislative session in Steamboat Springs in August. Donovan asked water managers for their support of Proposition DD, which would fund water projects grants and, potentially, a demand management program. Photo by Heather Sackett/Aspen Journalism

What is the Colorado Water Plan?

At the behest of then-Gov. John Hickenlooper, water managers from across Colorado collaboratively created the water plan, which was unveiled in 2015. The plan, which is more of a policy document, says Colorado faces a looming water “gap” across all sectors — municipal, industrial, agriculture, recreation and environment — because of the state’s growing population and increasing water demands.

The 567-page plan does not prescribe or endorse specific projects but instead sets Colorado’s water values, goals and measurable objectives, which are set out in a critical action plan. For example, the plan sets a measurable objective of storing an additional 400,000 acre-feet of water in reservoirs by 2050 and covering 80% of local rivers with stream-management plans by 2030, but it does not say how water managers should go about doing this.

The Colorado Water Conservation Board, after unveiling the Colorado Water Plan in Denver in November 2015. Revenue from Prop DD could go toward funding water plan grants. Photo: Colorado River District

What about water plan grants?

According to the legislation, revenue from Proposition DD will also go toward water-plan grants. Local water managers apply to the CWCB’s Water Plan Grant Program to fund projects that advance critical actions laid out in the water plan from the following categories: agricultural, engagement and innovation, environmental and recreation, water conservation and land-use planning, or water storage and supply.

Water-plan grants are a 50% matching grant, meaning that the local entities applying for the grant must match from their own coffers the amount they are requesting in state funds.

For fiscal year 2019-20, $10 million will be available for the Water Plan Grant Program. Funding from Proposition DD could add roughly $15 million a year to this grant program.

Many of the projects that the water-plan grants fund come from each of the nine basin roundtables’ Basin Implementation Plans. The BIPs identify how each basin’s water needs will be met through existing or new projects, policies and processes. But many of the local water projects included in the BIPs don’t specify how much funding is needed to implement them and many roundtables’ projects lists have only partial and inconsistent information.

For example, 14 of the 31 top projects outlined in the Colorado BIP have “TBD” in the Funding Needs column.

“In the Basin Implementation Plans, some of those projects are pretty rough and it was a best guess at the time with limited information,” said CWCB Deputy Director Lauren Ris.

Roundtables will soon embark on an update to their BIPs, with the goal of refining project details, including cost.

A view of the headgate on the Robinson Ditch and the boulder structure in the Roaring Fork River that maintains the grade of the river so water can reach the headgate. Pitkin County has received a water-plan grant to help repair the diversion structure and improve boating passage. Photo by Brent Gardner-Smith/Aspen Journalism

What is the funding gap?

According to the water plan, there is an estimated funding gap of $100 million per year over 30 years. These figures, according to Ris, came from data in the 2010 Statewide Water Supply Initiative. That technical analysis found that Colorado needed $20 billion worth of water projects to meet the water supply gap by 2050. Of that $20 billion, $17 billion is expected to be paid for by existing funding sources, including rate payers of water utilities and federal money.

The state is investigating options to fund the remaining $3 billion gap. Proposition DD is one of these options. But the $3 billion figure, based on decade-old data, is not precise.

“($100 million per year over 30 years) was an estimate,” Ris said. “I don’t think it was ever really intended to be an exact figure. It’s more to say, we know there’s going to be a big need and we will work to refine that estimate going forward … We are just trying to point out it’s an expensive endeavor going forward.”

Supporters of Proposition DD say they realize that the estimated $15 million raised per year is still a far cry from the estimated $100 million needed per year, instead calling the money a “down payment” on implementing the water plan.

The 2015 Colorado state water plan on the shelf of the CU law library in Boulder. The CWCB often presents updates on the progress it says it is making on implementing the plan. Photo by Brent Gardner-Smith/Aspen Journalism

Who is endorsing Proposition DD?

Proposition DD has received broad endorsement from environmental groups such as Conservation Colorado and American Rivers, agriculture organizations such as the Colorado Cattlemen’s Association and the Colorado Corn Growers Association, and several chambers of commerce.

The Colorado River Water Conservation District and Aspen Skiing Co. also support the measure.

Matt Rice of American Rivers said his organization is endorsing the measure because it wants to see some projects fully funded, including stream-management plans, urban water-conservation programs and modernization of agriculture irrigation infrastructure.

Rice said American Rivers “unabashedly and unequivocally” supports a demand-management program in Colorado, which Proposition DD could help fund.

“We deeply believe a demand-management program needs to be one of the tools that we have in our toolbox as we plan for water scarcity or prolonged drought because of climate change,” Rice said.

A river project, partially funded by the CWCB on the Arkansas River at Granite. The project was removing a river-wide diversion structure and replacing it with a new diversion structure that will allow unimpeded boating through Granite. Photo by Brent Gardner-Smith/Aspen Journalism

Who is opposed to Proposition DD?

Environmental group Save the Colorado and the political action committee Coloradans for Climate Justice oppose the measure. According to the Coloradans for Climate Justice Facebook page, the group believes fossil fuel companies should pay for the damage to water-supply systems caused by climate change. So far, the group has not filed any reports for contributions or expenditures.

The Colorado River in fall near Loma. Proposition DD could allocate tax revenue to a demand management program with the aim of leaving more water in the river. Photo by Brent Gardner-Smith/Aspen Journalism

Who is funding Proposition DD?

Despite broad support from many organizations, the political action committee Yes on Prop DD is funded primarily by the gambling industry. According to filings with the Secretary of State, as of Sept. 30, casinos and online sports betting organizations have spent nearly $1 million to support the measure. The Colorado Farm Bureau and the Environmental Defense Fund have contributed $10,000 each.

Editor’s note: Aspen Journalism is collaborating with The Aspen TimesVail DailySummit Daily, Glenwood Springs Post-Independent and other Swift Communications newspapers on coverage of water and rivers. This story appeared in the Oct. 10, 2019 edition of the above papers or on their websites.

The Water Desk’s mission is to increase the volume, depth and power of journalism connected to Western water issues. We’re an initiative of the Center for Environmental Journalism at the University of Colorado Boulder. The Water Desk launched in April 2019 with support from the Walton Family Foundation. We maintain a strict editorial firewall between our funders and our journalism. The Water Desk is seeking additional funding to build and sustain the initiative. Click here to donate.

Announcing our first grantees

The Water Desk is excited to announce our first grants to support journalists and media outlets covering Western water issues and the Colorado River Basin.

Grantees will delve into a wide range of issues throughout the region, including biodiversity, pollution, groundwater, climate change, public lands, energy development and tribal water rights. The journalists and outlets will use a variety of media—newspapers, magazines, websites, television, radio—to explore critical challenges facing the West’s water.

The recipients of The Water Desk’s 2019 standard grants (in alphabetical order):

The Water Desk’s standard grants award up to $10,000 to journalists and media outlets covering water issues involving the seven states of the Colorado River Basin—Arizona, California, Colorado, Nevada, New Mexico, Utah and Wyoming—as well as the borderlands of Northwest Mexico.

For the 12 standard grants, The Water Desk has approved a total of $112,888 in funding for journalists.

In addition to the standard grants, The Water Desk has also approved 10 micro-grants, up to $1,000 each, to support travel expenses, multimedia content and professional development for water journalists.

Applications for the standard grants were reviewed and approved by a selection committee consisting of: Mitch Tobin, Director of The Water Desk; Tom Yulsman, Director of the Center for Environmental Journalism; Hillary Rosner, Scholar-in-Residence at the Center for Environmental Journalism; and Amanda Clark, a recent graduate of CU Boulder’s master’s program in journalism who worked for The Water Desk.

The Water Desk launched with support from the Walton Family Foundation. Our funders and the University of Colorado have no right of review and no influence on the journalism that is produced with these grants.

The Water Desk will be running a similar program for standard grants in 2020 and is still accepting applications for 2019 micro-grants. Details about the grantmaking program are on this page.

Varsity Lake, near The Water Desk’s office. Source: Casey A. Cass, University of Colorado

Resources for Journalists

Grants

Goosenecks of the San Juan photo

Our grant programs offer funding to journalists to support their coverage and strengthen their professional development.

Stories & resources

Denver skyline photo

We will be producing and distributing original reporting, writing and multimedia on water issues while also serving as a hub for a network of water journalists.

Multimedia library

Colorado River drone photo

We will be offering images, video and data visualizations for free reuse by news organizations and independent journalists.

Aspen joins water managers using new technologies to map mountain snowpack, predict streamflows

Snowpack map photo
This map shows the snowpack depth of Castle and Maroon valleys in spring 2019. The map was created with information from NASA’s Airborne Snow Observatory, which will help water managers make more accurate streamflow predictions. Source: Jeffrey Deems/ASO, National Snow and Ice Data Center
By Heather Sackett

STEAMBOAT — As a changing climate renders streamflow predictions less accurate, water managers are turning to new technologies for a clearer picture of what’s happening in their basin’s snowpack.

The city of Aspen last spring became the latest water provider in western Colorado to use remote-sensing lasers from airplanes to map the snowpack in the surrounding watershed. On April 7 and June 10, planes equipped with LiDAR, which stands for light detection and ranging, flew over the mountains surrounding Castle and Maroon creeks, measuring the depth of the snow and how much water it contained.

The snow from Castle and Maroon valleys eventually becomes Aspen’s municipal water supply as it trickles downstream. Knowing how much snow is left and where that snow is located can help Aspen’s water managers better plan for spring runoff.

“The information (that the flights) were able to share with us shows us so much information about where the snow collects and some of the runoff patterns,” said Margaret Medellin, the manager of Aspen’s Utilities Portfolio. “It’s a more sophisticated way of looking at the water content in our snow.”

The flights were conducted by NASA’s Airborne Snow Observatory, or ASO, an initiative co-founded by Jeffrey Deems, a research scientist at the National Snow and Ice Data Center at the University of Colorado where the data will be archived and distributed. Last month in Steamboat Springs, Deems gave a presentation on mapping mountain snowpack at Colorado Water Congress.

“It removes a good portion of the uncertainty,” Deems said in a separate interview. “The better we can manage the system, the more everybody benefits and is less in conflict.”

Streamflow forecasts — used by irrigators, water managers, federal and state agencies, and other entities — are based primarily on data collected from snow-telemetry, or SNOTEL, sites. These automated, remote sensors collect weather and snowpack information in Colorado’s mountainous watersheds.

But SNOTEL sites provide just a snapshot, often not telling the whole story, which leads to inaccurate streamflow forecasts.

When conditions at SNOTEL sites start to creep outside of “normal” historic data due to climate-warming effects — early-spring melting, dust on snow, warm winter temperatures, fires and beetle-kill — the forecasting models can begin to lose accuracy. By mapping an entire watershed, ASO flights paint a more complete picture of the state of the snow.

“As the past becomes less of a good guide to the future, we really need to know in greater precision and accuracy what the current state of the snowpack is,” Deems said. “The folks who are making the decisions on how to manage our water infrastructure — whether that’s a ditch, a dam or a headgate — they need the best forecast possible so they can make the correct decision at the right time.”

Snowpack map photo 2
This map shows the snowpack depth of the Maroon Bells in spring 2019. The map was created with information from NASA’s Airborne Snow Observatory, which will help water managers make more accurate streamflow predictions. Source: Jeffrey Deems/ASO, National Snow and Ice Data Center

Avalanches and hydrology

The LiDAR mapping also has the potential to help water managers better understand extreme weather events such as the historic avalanche activity this past March. One of Deem’s LiDAR mapping photos showed mountain tops that were scoured and devoid of snow, and valleys and avalanche paths that contained deep piles — the result of huge avalanches. An unanswered question is whether this snow melted out sooner (because it slid to a lower elevation) or later (because avalanche debris is denser and more compact).

“It may actually have delayed melt into the runoff season,” Deems said. “It’s not something we can say definitively what the effect is, but for the first time, the data set may actually allow us to test that and get a better handle on how hydrology and avalanches interact.”

Denver Water, which provides water to 1.4 million people on the Front Range, last spring used ASO flights to see how much snow remained in the mountains surrounding Dillion Reservoir, its largest storage pool. Data from a June 24 flight showed that although the SNOTEL sites at about 11,000 feet were melted out, there was still 114,000 acre-feet of water in the snowpack above. Denver Water increased its outflows from Dillon Reservoir to make room for the coming snowmelt.

“That ended up being about half our seasonal runoff,” said Nathan Elder, Denver Water’s manager of water supply. “(ASO) is the next thing in snow measurement. We haven’t had an advancement like this since the late ’70s, when they started putting in SNOTEL sites.”

Snowpack map photo aerial view
A flight from NASA’s Airborne Snow Observatory gathers data about the snowpack above the reservoir on a June 24 flight. Information gathered from the flight helped Denver Water manage reservoir operations. Photo courtesy of Quantum Spatial

Costly technology

While innovative and useful, the technology is expensive. Over the past three years, the Colorado Water Conservation Board has spent $1.9 million on the Watershed Forecasting Partnership Program, with nearly $519,000 spent on ASO flights, according to Chris Arend, communications director for the Department of Natural Resources. The Castle and Maroon creek watersheds were mapped as an offshoot of a multiyear program in the Upper Gunnison River Basin.

A good approach, Deems said, would be for multiple local agencies to pitch in and share the cost, since each flight on the specially equipped plane can cost tens of thousands of dollars. For a small municipality such as Aspen, it’s just not worth it.

“It’s really hard to fund or justify funding big efforts like that,” Medellin said. “We are really excited about the data, but we have to think: Is this something we can really afford in this community? Right now, it seems like the benefit wouldn’t justify the costs.”

Editor’s note: Aspen Journalism collaborates with The Aspen Times and other Swift Communications newspapers on coverage of water and rivers. The Times published this story on Monday, Sept. 9, 2019. 

The Water Desk’s mission is to increase the volume, depth and power of journalism connected to Western water issues. We’re an initiative of the Center for Environmental Journalism at the University of Colorado Boulder. The Water Desk launched in April 2019 with support from the Walton Family Foundation. We maintain a strict editorial firewall between our funders and our journalism. The Water Desk is seeking additional funding to build and sustain the initiative. Click here to donate.

Data viz: explore our interactive dashboards for drought, precipitation and snowpack

snowpack dashboard map

Browse through the sports section of any newspaper and you’ll find tons of data dissecting the performance of teams and players. Flip to the business section and you’ll see a wealth of charts and figures tracking companies and economies. 

But what if your local media outlet had a section devoted to environmental issues like water? Imagine pages filled with statistics, graphics and maps tracking watershed health, river flows and water use trends. One of my goals for The Water Desk is to move us toward that vision. I want to see our atmosphere, snowpack, rivers, streams, reservoirs and manifold uses of water analyzed with the same fervor we devote to batting averages, stock indices and other metrics that are routinely reported in the media.

Sure, the weather section sometimes includes information on local reservoir levels, drought conditions and other water indicators. But these sections tend to focus on short-term conditions, rather than the big picture and how things are changing. Instead, imagine data visualizations and interactive maps that are not only way cooler than any box score but also allow you to step back in time so you can find your own trends and patterns.

Introducing interactive dashboards for water issues

As we launch The Water Desk’s website, I’d like to introduce you to three data visualizations that cover the closely related topics of drought, precipitation and snowpack. There’s also an interactive on dams and reservoirs that I’ll explain in a future post. At this point, we only have dashboards for the water supply, rather than water demand, but I’m hoping we can tackle that side of the equation soon.

water dashboard screenshots
Above: images from the drought, snowpack and precipitation dashboards.

To create this series of interactive dashboards, I’ve worked over the years with some accomplished data experts–Geoff McGhee, David Kroodsma and Erik Hazzard. I’m not a coder, and the prospect of learning the Python language appeals to me as much as curling up with a 20-foot snake. But Geoff, David and Erik managed to figure out how to make these dashboards self-updating so they can automatically ingest the latest data.

Below is some background on how the visualizations came about and how you can use them.

If you’d like, you can skip to the visualizations themselves.

EcoWest: tracking environmental trends

Before getting into the dashboards, let me quickly explain their genesis. From 2011 to 2015, I worked as an independent evaluator of the David and Lucile Packard Foundation’s grantmaking around Western environmental issues. As part of that consulting work, the foundation asked me and my colleagues at California Environmental Associates to develop a way to track trends in the region. Our solution was to create a website, EcoWest.org, which features blog posts, data visualizations and PowerPoint slide decks summarizing a variety of indicators and topics, including water, land use, climate, wildfires, biodiversity and politics. As with The Water Desk, EcoWest was editorially independent from its funders: we had complete freedom to research and write about the issues.

While working on EcoWest, I had the great fortune to do an (unpaid) fellowship at Stanford’s Bill Lane Center for the American West, where I got to work closely with Geoff, a veteran of the multimedia and infographics desk at The New York Times, Le Monde and ABCNews.com.

To make a long story short, we decided to create a series of dashboards that track key indicators so users can not only explore the data but also embed the visualizations on their own websites.

As the Packard Foundation’s Western Conservation subprogram ended, so did the funding for EcoWest, but I decided to keep the site operational even though I wasn’t adding new content. On their own dimes, Geoff and David continued to tinker with the dashboards and make improvements, but I’ve always regretted not doing more with the dashboards or disseminating them more widely.

Now, with The Water Desk underway, we’re relaunching the EcoWest dashboards and incorporating them into our website, which Geoff helped us build. We hope these interactives will be a useful tool for journalists and others who are interested in reporting on water.

Drought dashboard

Watch the West move in and out of severe drought

In recent years, drought has been in the news frequently as dry spells gripped large parts of the West. There are many ways to define and track “drought,” but the best known of these measures is the U.S. Drought Monitor, which reports conditions across the country and is widely reported in the media.

drought dashboard screenshot
Comparing drought conditions between 2014 and 2019.

The Drought Monitor publishes a weekly map on Thursdays that shows which parts of the country are in drought by using five color-coded categories. There’s “abnormally dry” (D0), which indicates areas going into or coming out of drought, then four escalating levels of drought: “moderate” (D1), “severe” (D2), “extreme” (D3) and “exceptional” (D4).

When you arrive at the drought dashboard, you’ll find yellow boxes akin to sticky notes that explain some of the features. If you’d like to go big, click on the icon in the upper right corner to expand the interactive.

Interactive map: current drought conditions

enlarge

The U.S. Drought Monitor is jointly produced by the National Drought Mitigation Center at the University of Nebraska-Lincoln, the United States Department of Agriculture and the National Oceanic and Atmospheric Administration

The drought levels represent a composite index that includes many indicators: the Palmer Drought Severity Index, the Standardized Precipitation Index and other climatological inputs; the Keech-Byram Drought Index for fire; satellite-based assessments of vegetation health and various indicators of soil moisture; and hydrologic data, particularly in the West, such as the Surface Water Supply Index and snowpack levels. For more on how the maps are made, see this piece by Grace Hood at Colorado Public Radio.

Colorado emerges from a brutal drought

Below are two views from the dashboard that focus on Colorado. The top image is from July 23, 2002, when Colorado and other Western states were in the grips of a brutal drought. That summer, the 138,000-acre Hayman Fire became the largest in Colorado’s recorded history. On the Colorado River, inflows to Lake Powell were about one-quarter of normal.

drought dashboard map
July 23, 2002, when Colorado and other Western states were in the grips of a brutal drought. See visualization on this date.

Fast-forward 17 years to the bottom graphic, showing July 23, 2019, and Colorado was virtually drought-free after one of the wettest winters in decades wiped out a dry stretch that was particularly bad in the southwestern corner of the state.

drought dashboard map
July 23, 2019, when Colorado was virtually drought-free after one of the wettest winters in decades. See visualization on this date.

In the bar chart below the map, clicking on different dates will transport you to that week’s Drought Monitor as well as bring up a tooltip that shows you what percent of the area was in the various categories of drought. On July 23, 2002, one-third of Colorado was suffering from exceptional drought and the other two-thirds of the state were in extreme drought; by contrast, on July 23, 2019, just 3 percent of the state was classified as abnormally dry.

If you use the dropdown menu above the chart–or click on a state on the map–you’ll be brought to a chart showing drought conditions over time for the selected state or region. Clicking on the timeline or dragging the slider will update the map display to the selected week.

The “i” icons on the map indicate that a narrative about that location or region is available for the selected week. Clicking on the icon will reveal a text box with a discussion and forecast written by the U.S. Drought Monitor analysts.

If you want to embed this dashboard on your site or share the view you’ve created, click on the “share” button in the upper right and you’ll find options for republishing and distributing the visualization.

Precipitation dashboard

From atmospheric rivers to parched plains: visualizing rain and snow patterns

Precipitation patterns are obviously a big part of why droughts come and go, but it’s important to remember that temperature can also be important and create so-called “hot droughts” in which a higher evaporation rate is a leading player in the meteorological drama. For example, a seminal 2017 paper by Bradley Udall and Jonathan Overpeck, found that a big chunk of the 2000 to 2014 drought on the Colorado River was due to higher temperatures, not just reduced precipitation, with future warming projected to cut the river’s flow even further.

While the drought maps change relatively slowly and the shapes are only updated once a week, precipitation is much more dynamic and fine-grained. I’d love to tell you we have a constantly updating map of the country showing where every drop and flake has fallen over the past five minutes, but we’re not there yet. Instead, our precipitation maps focus on the monthly average.

When you arrive at the precipitation dashboard, you’ll be greeted by an intro screen with sticky notes explaining the features. The map shows how much rain and snow fell every month in the contiguous United States, from 1981 to the present. We offer a couple of ways to slice and dice the data:

  • Total precipitation
  • Difference from the long-term average
  • Percent of average for that month

For example, the screenshot below shows March 2019 precipitation as a percent of the monthly average. It was a wet month here in Colorado and neighboring Utah, but the weather was much drier than normal along the Pacific Northwest coast. If you click on one of the states, you’ll bring up a bar chart showing how that month’s precipitation compared to the 30-year average and the rest of the year.

rain and snow dashboard map
March 2019 precipitation as a percent of the monthly average. It was a wet month here in Colorado and neighboring Utah, but the weather was much drier than normal along the Pacific Northwest coast.

The data for this dashboard comes from the PRISM Climate Group at Oregon State University, which uses weather station data and a sophisticated model to report monthly and daily precipitation for the contiguous United States at a resolution of about 800 meters (around a half-mile). Including all that data would make for a painfully slow map, so we’ve reduced the resolution to four kilometers (about 2.5 miles) per pixel. 

The timeline below the map shows monthly rainfall totals for the selected geography. By default, the chart shows the average monthly precipitation for the contiguous United States since January 1981. Using the dropdown menu above the chart or clicking a state on the map will redraw the chart to show the precipitation over time for the selected state. 

As with our other dashboards, you can embed the precipitation map on your own website or share via social media by clicking on the “share” button in the upper right.

Snowpack dashboard

Measuring the frozen reservoir vital to Western water supplies

Loveland ski area photo by Mitch Tobin
A skier along the Continental Divide at Loveland Ski Area in Colorado. Photo by Mitch Tobin

Here in the American West, our water supply hinges on the snowpack that accumulates each winter in the high country. Snowmelt supplies the bulk of the flow in many Western rivers, so the volume of snow in the mountains is an obsession not only for ski bums like me but also for water managers, farmers, paddlers and others downstream.

Truth be told, our snowpack dashboard doesn’t exactly come alive with breaking news in August. Like most sports, the snowpack has a season. But even in the middle of summer, you can use the snowpack interactive to look back at past years.

Our snowpack map shows the daily estimates for the contiguous United States since October 2003. Using the dropdown menu above the chart or clicking a state on the map will redraw the chart to show the snowpack estimate by day for the selected state. 

This data set is based on output from the National Weather Service’s National Operational Hydrologic Remote Sensing Center (NOHRSC) SNOw Data Assimilation System (SNODAS).

You have two options for displaying the snowpack data:

  • “Monochrome” paints the map with varying intensities of white
  • “False color” uses blues and purples to depict the snowpack’s snow-water equivalent (SWE), a measure of its water content 

Rather than insert a screenshot, I clicked on the “share” button to create some HTML code for the map embedded below, which shows data from March 11, 2019, when the nation’s snowpack was near its peak.

enlarge

Below the map you’ll find a chart showing the volume of the snowpack going back to 2004. As with the drought and precipitation maps, you can zoom in on specific states.

Another feature of this dashboard is a line graph that shows the snowpack’s rise and fall by year. In the visualization embedded below, the blue line marks the 2018-2019 winter.

At first, the West’s snowpack season seemed unremarkable, but in February and March, a series of potent storms led to some of the deepest conditions in recent memory and a ski season to remember. 

We hope folks find these dashboards useful, and we’d appreciate hearing from anyone who uses or embeds them. Please feel free to send us feedback or reports about bugs by emailing waterdesk@colorado.edu.

A feverish stream, a legion of volunteers, a $1.7 million grant. Is it enough to help the Yampa River keep its cool?

Yampa River climate change GIF
The Yampa River, June 29, 2019: Credit: Kelsey Ray, CU News Corps, The Water Desk

By Jerd Smith

Could something as simple and natural as a ragged corridor of expansive, towering shade trees help a river arm itself against a world in which temperatures are rising?

In northwestern Colorado’s Yampa River Basin, a 300-person-strong army of volunteers is banking on it.

The Yampa River historically has produced so much abundant, clear, cool water that its fish, kayakers, and the farmers along its banks were rarely left wanting.

But climate change is altering that dynamic. Last summer the river’s flows shrank sharply, and its formerly cool waters became dangerously warm, threatening the fish. Its high fever prompted the City of Steamboat Springs to close the popular stretch through town to fisherman and boaters on multiple occasions to avoid further stressing the mountain white fish, which is found in few other Colorado regions.

The shut-down was a huge blow to the city and to local rafting and tubing companies who rely on the river for their livelihoods.

The disturbing heat added urgency to a small program that has been gaining supporters and clout in the Yampa River Basin. The Yampa Sustainability Council (YSC), aided by $175,000 from local donors and some state grants, has ramped up a broad-based tree planting program along the river’s banks known as ReTree. Additional funding from a new $1.7 million Nature Conservancy water fund will add even more muscle to the effort.

On a hot Friday afternoon in late June, Sarah Jones, executive director of the YSC, parks at a trailhead just east of town, slathers herself in sunscreen, and loads a white plastic bucket with small calipers, a measuring stick, a GPS device and wooden stakes to take down to the river’s edge. These are the tools she and others will use to carefully locate and measure the progress of trees planted in recent years.

A restorative area on the Yampa River where groups are working to plant trees on the land surrounding the river in hopes of providing natural shade and coverage for the river in the future. June 28, 2019. Credit: Callie Rhoades, CU News Corps, The Water Desk
A restorative area on the Yampa River where groups are working to plant trees to provide natural shade and coverage for the river in the future. June 28, 2019. Credit: Callie Rhoades, CU News Corps, The Water Desk

The reforesting work is conducted with a careful, slow precision. Each tree that is planted along the banks, and there are hundreds, is assessed, measured and located each season, even as more are placed in the ground.

The trend of warming rivers is creating a need for new science and reams of field data. “This is a new, not well-understood problem,” Jones said.

She and her partners, including the Colorado State Forest Service and the City of Steamboat, are taking the long view, carefully evaluating each year what has worked, discarding practices that have failed, and boosting those that have succeeded.

They once used elaborate planting protocols for placing the young saplings in the ground, but the trees respond much better when their small root balls are poked into the side of the bank, almost casually, supported by simple twigs. The starter trees also like being planted in the fall, they’ve learned, not the spring.

The Yampa River, in some ways, is a blessed stream, with more water than most Western rivers, and a community of hard-working, often wealthy, advocates.

This year The Nature Conservancy announced it had raised $1.7 million in a long-term water fund to restore and protect the Yampa River. The goal is to raise another $4.3 million to protect the watershed.

It is an unheard-of sum in this remote, northwestern corner of the state.

But those who know the Yampa understand the significance of protecting it, not just for the sake of this region, but for the state of Colorado and even for the greater American Southwest.

The river sits near the headwaters of the drought-stressed Colorado River system and is one of its last, mostly free-flowing tributaries. Because it is relatively unhindered, with only a few small reservoirs high on its mainstem, it serves as a kind of benchmark for scientists seeking to understand natural river dynamics and mimic them elsewhere.

Keeping the Yampa healthy also helps a much broader effort in the West to bring the Colorado River system back from the edge of a crisis precipitated by population growth, a nearly 20-year drought, and rising temperatures.

Jones and her colleague Caroline Manriquez, assistant district forester with the Colorado State Forest Service, walk slowly along a public stretch of the river. Each of them notes the young trees planted two or three years ago that are outgrowing the metal cages put in place to protect them from beavers, who are both a curse and a blessing on the river.

“On the one hand we want them,” said Manriquez, because their work on the river creates natural dams and habitats. “But on the other hand, they’re cutting the trees we want to preserve.”

Each tree that outgrows its anti-beaver cage will need to be visited, its protective metal enclosure cut off and a bigger one put in place.

The re-treeing effort anticipates a Johnny-Appleseed kind of longevity, with some 200 shade trees planted annually over the next 20 years.

“This is a huge project, and we are planting very small trees,” Manriquez said. “But given the water issues climate change is creating, we decided we had better start now.”

Like other river basins around the state, the Yampa Basin has developed a state-funded management plan for the river. Some of that funding went toward several years of studies and planning to develop the science to support the reforestation effort, said Kelly Romero-Heaney, water resources manager for Steamboat Springs.

“We’ve done a tremendous amount of modeling to look at what this river will look like in the future,” Romero-Heaney said.

Just downstream of the work zone, on the opposite bank from the workers, is a nursery which houses hundreds of delicate, young willow, cottonwood, and box elder trees. These varieties are known for growing tall and spreading a generous shade canopy.

The young seedlings have been sprouted in a nursery in Fort Collins, then transferred up to the Steamboat nursery early in the summer, all in preparation for the fall planting season.

These seedlings will be planted in the public stretches of the river, but reforesting there alone won’t be enough.

Jones and Manriquez know that the key to success for the project will be to bring the private landowners who control most of the land on the river’s banks into the program.

And that’s not easy. Western ranchers are notoriously government-averse, skittish about letting federal and state environmental officials onto their property, they said.

Rancher Steve Williams is an exception. He owns 200 acres of land along a critical reach of the Yampa east of Steamboat Springs, one that has been degraded by heavy cattle grazing, its cottonwood canopy gone, its streambed wide and much shallower than it once was.

Steve Williams, a local rancher in Steamboat Springs, is showing a section of the Yampa River he works to protect and conserve that flows through his land. June 29, 2019. Credit: Callie Rhoades, CU News Corps, The Water Desk
Steve Williams, a local rancher in Steamboat Springs, shows a section of the Yampa River through his land that he works to protect and conserve. June 29, 2019. Credit: Callie Rhoades, CU News Corps, The Water Desk

As a result the water temperature here each summer threatens to exceed the state’s standard for the stream. If Williams can cool down his reach of the river, it will help everyone farther down and closer to Steamboat Springs.

To achieve this, he has partnered with federal agencies to shore up the river’s banks, deepening it as it curves, snakelike, through the wetlands and pastures above Lake Catamount.

This land hasn’t been grazed in 10 years, Williams said, and he’s hopeful the bank restoration work, as well as the re-treeing effort, will give this stretch of the river the assistance it needs to heal.

Williams understands the magnitude of the work that lies ahead and the challenges, the discrepancy in scale between young trees and a sprawling Western river, and the global dilemma of warming. “We will see how this goes,” Williams said. “It is a Band-aid, but it’s one I think will last at least through my lifetime.”

Romero-Heaney and other river advocates know that they will likely never see the final results of this reforestation effort, but based on the preliminary studies, they see it as an important tool for helping this playful, powerhouse of a river flourish in a very different world than it has inhabited up until now.

“I have to believe that if any river can persist through climate change, it will be the Yampa,” Romero-Heaney said.

This story is made possible, in part, by The Water Desk, an initiative of the University of Colorado’s Center for Environmental Journalism.

Jerd Smith is editor of Fresh Water News. She can be reached at 720-398-6474, via email at jerd@wateredco.org or @jerd_smith.

This story originally appeared on Fresh Water News, an independent, non-partisan news initiative of Water Education Colorado. WEco is funded by multiple donors. Its editorial policy and donor list can be viewed at wateredco.org.

Defining The Water Desk’s scope and water journalism

“Water journalism? What’s that?”

I’ve triggered this response from people on chairlifts, airplanes and other places I tend to meet strangers.

When folks ask what I do, I tell them I’m working on a water journalism initiative at the University of Colorado in Boulder. Unless the other person is a media professional or a water wonk, my statement is apt to draw a quizzical look.

Average citizens know about “political” journalism, “sports” journalism, “business” journalism and other sub-disciplines that sometimes warrant separate sections in newspapers, or even publications unto themselves. But water journalism isn’t as well known—at least not yet.

water journalism drone photo
Drone view of rafters on the Colorado River, near Radium, Colorado. Photo by Mitch Tobin

For folks who are initially confused about water journalism, it usually doesn’t take long for them to get the concept. They start to think about water pollution and episodes like the lead poisoning in Flint. They recall the many news stories they’ve seen or heard about extreme droughts and floods whipsawing places like California and Colorado in recent years.

Public opinion surveys show most people don’t know where their water comes from beyond a general notion that it’s some river, reservoir and/or well. All too many of us take water for granted, because at least for now in the United States, the vast majority of citizens—but certainly not all—have a water supply that is clean, reliable and relatively affordable.

But if you’re one of the unfortunate people in this country or elsewhere whose water supply isn’t safe and secure, the subject can be impossible to ignore and warrants as much attention as possible from journalists, politicians and others. Just in California, home to one of the greatest concentrations of wealth and economic activity on the planet, around 1 million people are exposed to unsafe drinking water; globally, billions of people lack access to safe drinking water, managed sanitation or basic handwashing facilities, according to the World Health Organization.

Non-human species also depend on water for their survival, but here at home and around the globe, we have utterly transformed aquatic and riparian habitat by damming, diverting, depleting, defiling and destroying streams, rivers and underground aquifers, not to mention heating up the planet and spreading invasive species all over the place.

More than ever, we need water journalism to not only explore and expose these complex problems but also explain potential solutions to the public and policymakers. Unfortunately, the demand for more and better water journalism is coming at a time when the media landscape has been rocked to its core by tectonic shifts in how people consume news and access information.

With journalists continuing to be laid off and entire publications still collapsing on a regular basis, The Water Desk is starting up at a pivotal moment for both the news industry and the water sector.

Shining a light on a murky field

When you think about how important water is to every person on Earth, devoting more news coverage to the decisions, policymakers and institutions responsible for our water resources seems like a journalistic no-brainer.

A central goal of water journalism is to shed light on this critical yet murky part of our world in order to expand public understanding of water issues so that individuals, businesses, governments and other entities can make better-informed decisions about the most precious of natural resources.

In essence, water journalists need to constantly remind their audience that they shouldn’t, in fact, take their water for granted. Actually, they should care deeply about where their water comes from, what’s in it, how it’s used, what it costs, where it goes, who’s calling the shots and how human demands for water are affecting nature.

water journalism denver photo
Sloan’s Lake in Denver. Photo by Mitch Tobin

Most of us, myself included, need a better grasp on a slippery concept: water is embedded in virtually every product we buy—from beer to tomatoes to jeans to phones to cars. In addition to our carbon footprints, we also have water footprints.

Saying you’re a water journalist may not seem like the best icebreaker, but if you start talking about water issues, it turns out that many people are keenly interested in the subject. The word “important” comes up constantly, and that’s borne out by a spate of public opinion polls conducted over a span of decades. These surveys have consistently shown that water is at the top of Americans’ environmental and health concerns.

For example, in an April 2016 poll by the Kaiser Family Foundation, Americans said contaminated water was as serious a health problem as heroin abuse (for more on water-related public opinion, please see my previous project, waterpolls.org).

water journalism poll slide
In this poll, Americans said contaminated water was as serious a health problem as heroin abuse. Source: Kaiser Family Foundation Health Tracking Poll

Year after year, decade after decade, surveys conducted by Gallup have found that pollution of drinking water, rivers, streams and lakes rank much higher than other environmental concerns, such as climate change and the loss of biodiversity.

But it’s not just pollution that evokes worries. Especially in more arid places like the American West, where The Water Desk is focusing its work, the increasingly dubious supply of water also troubles the majority of residents. The Conservation in the West Poll, produced by Colorado College’s State of the Rockies Project, has found Westerners of all political stripes are concerned about low water levels in rivers and think our water supplies are getting less predictable.

water journalism poll slide 2
Westerners of all political stripes are concerned about low water levels in rivers and think our water supplies are getting less predictable. Source: Conservation in the West Poll

As someone who has tried to explain water journalism and fundraise for it, I sometimes hear variants of the line that “water isn’t sexy.” Not so! It’s true that water issues can be as dry as dust. It’s easy to get bogged down in a quagmire of laws, hydrology, engineering and local politics.

But if you actually start covering water issues, as I did frequently as a newspaper reporter in California and Arizona from 1998 to 2006, you quickly realize that water does, in fact, animate your audience and inspire passionate reactions. Sitting through a five-hour hearing on sewer rates is unlikely to stimulate any erogenous zones, but nowadays I think water journalism is as exciting and important as any beat: we’re covering the lifeblood of every economy, ecosystem and community just as the entire hydrologic cycle of the planet is being amped up by climate change. Sounds pretty juicy to me.

Fresh water is scarce on the blue planet

Despite freshwater’s importance—and rarity—on Earth, water issues are typically ignored unless there’s an immediate crisis, such as a drought, flood or contamination episode. One of my favorite visual summaries of water issues is this cartoon from the National Drought Mitigation Center that depicts the “hydro-illogical cycle.”

water journalism hydro-illogical cycle
This cartoon from the National Drought Mitigation Center depicts the “hydro-illogical cycle.” Source: National Drought Mitigation Center

Here in the United States, it’s easy for most people to forget about water outside of a crisis. But if you’ve ever spent time in the developing world, suffered in a natural disaster, backpacked in the desert or lived in one of the disadvantaged communities where clean water is a luxury, you know there’s nothing more critical and visceral than water. In fact, up to 60% of our bodies consist of the stuff, according to the U.S. Geological Survey.

You can live for weeks, even months or years, without adequate food, clothing or shelter. Deprived of water, you’re speeding toward a horrible death in a matter of days.

If there are any extraterrestrials spying on the Earth, I wouldn’t be surprised if they refer to our home as the “blue planet” or “water world” since about 71% of the surface is covered by the liquid. When astronomers and astrobiologists scan the heavens looking for possible life on other planets and their moons, they’re often looking for liquid water since it is, to the best of our knowledge, a prerequisite for life.

Our home planet, said to resemble a blue marble from space, is mostly covered with water, but the supply of freshwater that we can actually drink is minuscule by comparison. In the visualization below from the U.S. Geological Survey and Woods Hole Oceanographic Institute, the largest blue sphere shows all of the water on, inside and above the Earth, nearly all of it saltwater in the oceans. The volume of liquid freshwater is a tiny fraction of that: the second largest sphere over Kentucky is only 169.5 miles in diameter. And that tiny dot located around Atlanta you may not even be able to see? That sphere, just 35 miles across, represents all of the freshwater in the world’s rivers and lakes.

water journalism the world's water
That tiny dot located around Atlanta you may not even be able to see? That sphere, just 35 miles across, represents all of the freshwater in the world’s rivers and lakes. Source: U.S. Geological Survey

Our rivers and lakes are the most obvious and visible manifestation of our freshwater resources, but the graphic below shows why this supply is so scarce. Oceans account for 96.5% of all the water on Earth, and nearly all of the remaining water is either saline, locked up in glaciers and ice caps, or buried under ground, sometimes at depths that aren’t economical for pumping. Much of the freshwater that’s left over is ice and permafrost (at least for now).

where is earth's water slide
Oceans account for 96.5% of all the water on Earth, and nearly all of the remaining water is either saline, locked up in glaciers and ice caps, or buried under ground. Source: U.S. Geological Survey

Follow the water

Water is an essential, scarce commodity that we all need to survive. That sounds like another substance: money.

To find truth, journalists are supposed to “follow the money,” a famous line from the 1976 film All the President’s Men. (The phrase actually isn’t in Carl Bernstein and Bob Woodward’s book about the Watergate investigation but was apparently uttered in a congressional hearing in 1974.)

“Follow the money” is sound advice because money is something that journalists, detectives, auditors and others seeking facts can at least try to count and track.

“Follow the water” is how one might summarize the goal of water journalism. Just as the “sports desk” at a newspaper covers the hometown teams and the “business desk” is for reporters and editors who track the economy, a “water desk” is supposed to follow this all-mighty substance as it flows throughout our economy and environment.

Today, it’s rare for general interest media outlets, such as newspapers, radio and TV, to dedicate an entire position to covering water. Many publications lump water coverage into the “environment” beat, which can also encompass a staggering number of other issues: climate, energy, wildlife, wildfires, development, public lands, air quality and more.

Defining water coverage as solely a sub-discipline of “environmental journalism” can pose some challenges. Don’t get me wrong: I think environmental issues are paramount in the water world. The Water Desk is based at the Center for Environmental Journalism, and I’m a card-carrying member of the Society of Environmental Journalists.

But water is more than just an “environmental” topic to be covered by “environmental journalists.” To be sure, the subject is immersed in green issues—climate change, biodiversity, pollution, growth and so on. But water stories can and should cover plenty of other terrain: it is a “business” and “economics” story because water it is crucial to everything from global supply chains to mountain-town economies, including the $1.4 trillion in annual economic output fueled by the Colorado River and its tributaries. It’s a “government” and “politics” story since public policies are so pivotal and many key decisions are made by government agencies or quasi-public entities.

Given that each of us depends on drinking and eating to survive, and most of us pay to use water, there are also “consumer,” “food” and “agriculture” dimensions to water journalism. Water is an “energy” story because there is such a strong nexus between the two sectors: fossil fuel and nuclear power plants require gobs of water while our waterworks demand tons of energy to treat, pump and move water.

Water journalism can also have a major “recreation” or “sports” component: think of all the publications that focus on leisure-time activities dependent on clean, reliable water, be it liquid or frozen. In many communities, the rivers, streams, lakes and snowpack are essential to not only the local economy but also the culture, so water generates plenty of stories for the “lifestyle” or “weekend” section of a publication.

I’m usually not a fan of quote marks, but I’ve added them above because so often our journalism and other narratives are shoe-horned into such categories. I want water journalism to transcend these quotational buckets and cover all of the above to ensure that the public understands what everyone in the water field knows in their gut: water is intertwined with nearly everything and is absolutely integral to life. As 12-term Colorado Congressman Wayne Aspinall once said, “In the West, when you touch water, you touch everything.”

aspinall quote photo
A memorial to Wayne Aspinall in Palisade, Colorado. Photo by Brent Gardner-Smith, Aspen Journalism

Defining our geographic scope

The Water Desk is all about water in its manifold forms and functions: source of life, basis for food, feedstock of the economy, not to mention fun stuff to fish, ski, and paddle.

One of the tricky yet fascinating aspects about covering water is that it’s constantly moving around and being reused downstream. Water is also the ultimate shape-shifter: the liquid can freeze solid, then sublimate into vapor, then condense back into liquid, then evaporate into the sky before precipitating—and on it goes around the globe. Fog, drop, flake, glacier, river, ocean, cloud—water transmogrifies through an amazing variety of forms ranging from the microscopic to the hemispheric.

While acknowledging the planetary nature of the hydrologic cycle, we have more humble and realistic ambitions for our work at The Water Desk. At least for starters, we’re focusing our coverage and grantmaking on just one part of North America.

Broadly speaking, The Water Desk is interested in a field that is often described as “Western water” or “water in the West.” As I discuss below, our focus is even a bit narrower since we are concentrating on the drier, Southwestern portion of the region, but suffice to say that among hydrologists, lawyers, policymakers, funders, publishers, conference planners and others, there is a field known as “Western water” that concerns management of the resource west of the 100th Meridian, the longitude that has traditionally marked the start of the more arid region where irrigation is necessary to support agriculture.

For this iconic demarcation, we can thank John Wesley Powell, the one-armed Civil War veteran and second director of the U.S. Geological Survey who explored the Green River and Colorado River in an epic expedition 150 years ago. The map below, from an 1891 USGS report, shows how Powell defined the arid region, which excludes the wetter areas of the Pacific Northwest and Northern California.

powell map photo
This 1891 map shows how John Wesley Powell defined the arid West, which excludes the wetter areas of the Pacific Northwest and Northern California. Source: U.S. Geological Survey’s 11th Annual Report, 1891

Despite the primitive technology of his time, Powell was onto something. The map below visualizes the 30-year average of precipitation across the United States from 1981 to 2010. I’ve superimposed the approximate location of the 100th Meridian, which really does demarcate a much drier portion of the nation, especially if you exclude the wetter Pacific Northwest.

precipitation map

The 100th Meridian (line added by author) has traditionally demarcated a much drier portion of the nation. Data source: PRISM Group, Oregon State University

But before you get too attached to the 100th Meridian, you should know that it has become obsolete due to climate change. Recent research has found that drier conditions have spread east by some 140 miles. It’s one of many climate zones around the world that are on the move in the Anthropocene, the modern epoch in which humans are transforming virtually every natural process on the planet.

In 2019, “beyond the 98th Meridian” might be the better definition for Western water issues. In fact, the issue of aridification—a long-term drying of the region due to changing temperatures and precipitation patterns—is fertile ground for some great journalism.

Although the West has the nation’s driest weather, one of the many awesome features about the region is that it simultaneously boasts the lowest- and highest-elevation terrain, as shown in the left map below. In fact, just 85 miles separates the top of Mount Whitney and the bottom of Death Valley, the highest and lowest spots in the 48 states. Not only that: the West is also home to some of nation’s hottest and coldest mean temperatures, as shown in the right map.

elevation and temperature map
One of the many awesome features about the region is that it simultaneously boasts the lowest- and highest-elevation terrain, as shown in the left map. The West is also home to some of nation’s hottest and coldest mean temperatures, as shown on the right. Data source: PRISM Group, Oregon State University

Focus on the Colorado River Basin

The Water Desk is concentrating on issues west of the ~98th Meridian, where the relative scarcity of freshwater and the region’s more recent development has yielded a legal landscape and physical infrastructure that’s distinct from the political and hydrologic regimes back East. Within this sprawling and diverse geography, we are focusing on a smaller region centered on the Colorado River Basin.

The emphasis on the Colorado River Basin and surrounding areas stems in part from the priorities of our initial funder, the Walton Family Foundation, which has a large grantmaking program in the region. The Water Desk maintains a strict editorial firewall between its editorial content and its funders, but the foundation’s grant does specify the broad geography we should focus on (for more on the foundation’s role in Colorado River issues, see this series from Jeremy Jacobs of Greenwire).

Focusing on the seven states of the Colorado River Basin and Northwest Mexico leaves out a big chunk of the West, and we mean no disrespect to our friends in Oregon, Washington, Idaho and Montana. But with the limited resources of a start-up, we’d be on a fool’s errand to extend our coverage to that part of the country. If, however, The Water Desk can acquire additional financial support, I can easily imagine expanding to the Pacific Northwest, Texas or other regions! 

The graphic below from the U.S. Bureau of Reclamation illustrates the hydrologic boundaries of the Colorado River Basin and also adds another critical dimension: areas beyond the physical watershed that still depend on the river and its tributaries for their water supply, at least in part (see this post for more maps of the basin).

Colorado River Basin Map
This map illustrates the hydrologic boundaries of the Colorado River Basin and adds another critical dimension: areas beyond the physical watershed that still depend on the river and its tributaries for their water supply, at least in part. Source: U.S. Bureau of Reclamation

In and around the Colorado River Basin, we built herculean dams that turned rivers into reservoirs. We bored colossal tunnels through mountains. And we constructed a sprawling network of infrastructure to not only to move water uphill to desert cities such as Phoenix and Tucson but also to export the Colorado River beyond the watershed’s boundaries to supply Denver, Albuquerque, Salt Lake City and Southern California.

Basin states: one-fifth of U.S. population and economy

As director of The Water Desk, I can assure you that the region around the Colorado River Basin is more than enough to keep us occupied. According to the U.S. Census Bureau, the seven basin states had 61.3 million residents in 2018, or 18.7% of the nation. Nearly two-thirds of the basin’s population lives in California, which is home to almost one in eight Americans. Looking at economic activity, the basin’s GDP of $4.2 trillion accounts for 20.3% of the national total, according to the Bureau of Economic Analysis.  

Within these seven states lie extremes in climate, topography, wealth, politics and people. The map below, which I created using data from The Nature Conservancy, shows that this one part of the country is also home to a tremendous diversity of ecoregions.

The West's terrestrial ecoregions
This one part of the country is also home to a tremendous diversity of ecoregions. Data source: The Nature Conservancy

The West boasts an impressive spectrum of weather, elevation, vegetation, geology and cultures. But one thing that unifies the region is its rapid population growth over the past century or so. The Colorado River Basin accounted for just 2% of the U.S. population in 1850, when only a half-million people lived in the region that would eventually encompass seven states. Today, it seems like I see a half-million people in a single morning on Colorado’s I-70 while driving up to the mountains to ski a powder day. 

Population of Colorado River Basin States

A fundamental dilemma facing water in the West is that the region’s meteoric growth rate has deposited millions of people in places where there’s not a whole lot of water available without massive human interventions, which tend to be economically and environmentally costly. Most of California’s water is in the northern half of the state, but far more people live down south; in Colorado, most of the precipitation falls to the west of the Continental Divide, but the great majority of the population lives on the other side of the mountains.

Population growth and climate change are some of the defining challenges for the American West, especially its water resources. But there are certainly other threats, such as the armada of invasive fish, plants, crustaceans and other non-native species that are causing chaos in ecosystems already disrupted by human activity. In many areas, critical water infrastructure is crumbling and in need of expensive repairs.

As any water journalist will tell you, there is no shortage of news in the field and trying to keep up with it all can feel like drinking from a firehose. It’s our job to distill that ocean of information into something digestible for average citizens. Compared to guns, immigration, health care and other political issues, water may not be top of mind for most people, but I think there’s a deep reservoir of interest and concern in the public that we should be tapping into.

I hope you’ll come aboard and join us on this journey as we follow water issues! If you’d like to stay connected, please sign up for our email newsletter and follow us on Twitter, Facebook and Instagram.

Decades later, abandoned mines continue to haunt Colorado’s waterways


Nestled at the headwaters of Lefthand Creek, a mile south of Ward, Colorado, sits the Captain Jack Mill. From 1860 to 1992, the area was a hot spot for gold and silver mining and though the tunnels of the mine have long been empty, the legacy of pollution continues to damage nearby waterways, aquatic life and drinking water.

According to a 2017 study, there are over 23,000 abandoned mines across Colorado and 1,800 miles of streams that are impaired due to pollutants related to acid mine drainage.

The pollution is formed when pyrite (an iron sulfide) is unearthed during mining operations and chemically reacts with air and water. The reaction forms sulfuric acid and dissolved iron, which causes the red, orange or yellow sediments that can be seen at the bottom of contaminated streams. The acid runoff can further dissolve heavy metals such as copper, lead and mercury, which can then leach into and contaminate streams, lakes and groundwater.

That’s what happened in 2015, when the Animas River turned orange after workers accidentally released toxic wastewater from the Gold King Mine in southwest Colorado.

Acid Mine Drainage Sites Span Colorado’s High Country

The state’s Division of Reclamation, Mining and Safety has identified hundreds of inactive mine sites with potentially hazardous water drainage conditions. The map below shows both sites that are currently under restoration and those that have not yet been addressed. The Captain Jack Mill site, below, was designated a U.S. EPA Superfund site in 2003, and construction was completed in 2012; last year, the site was associated with a fish die-off in a nearby creek.


In Colorado and beyond, acid mine drainage has the potential to pollute vital waterways long after mineral extraction has ceased. Part of the problem is the lack of environmental safeguards put in place in the late 1800s, when mining operations started to boom. By the time the Federal Mine Safety and Health Act was enacted in 1977, much damage had already been done.

“Most of the books that address these kinds of problems often start off with, ‘Mines from the Roman times are still generating acid mine drainage,’” said Joe Ryan, an environmental engineering expert at the University of Colorado Boulder.

Working with the nonprofit Lefthand Watershed Center, Ryan traced the source of dissolved metals contaminating the Left Hand Creek watershed, which provides drinking water to 20,000 customers.

In 2004, Ryan and a team led by the University of Colorado’s Alice R. Wood released a report that ranked the Big Five Tunnel at Captain Jack Mill as high priority for reclamation, shortly after the mine was designated as a Superfund site. Even so, it took more than a decade for a remedy to be implemented.

Cleaning up the past

In 2016, the EPA attempted to plug up the mine’s opening by filling the mouth of the Big Five Tunnel with limestone and a bulkhead valve. The limestone was meant to decrease the acidity of the water that collected behind the valve so that it was less harmful to the creek.

But it didn’t quite work.

When the water was released from the bulkhead seal inside the Big Five Tunnel in October 2018, it was too acidic and polluted a five-mile stretch of the river, leaving hundreds of dead fish in its wake.

Following the 2018 release from the tunnel, a portable treatment system was installed to process water from the bulkhead valve before it flows into Lefthand Creek. Though effective, this method is an expensive addition to the already steep cleanup costs.

“There have been anecdotes about fish being back in locations that they haven’t been seen in for quite a long time,” said Ryan, who plans to revisit Lefthand Creek to determine if the cleanup efforts have improved the stream’s water quality.

Between 1998 and 2003, the U.S. Forest Service estimated that more than $310 million was spent cleaning up acid mine drainage around the country.

“I think people didn’t really understand the connection between some of what they were doing and the long-term impacts associated with it,” said Jeff Graves, director of the inactive mine reclamation program for Colorado’s Department of Natural Resources. “These old miners that did the work weren’t bad guys, they just had a different mindset.”

Graves, who helps enforce mining regulations in the state, assesses and develops plans related to the safety and environmental impact of legacy mines, including those designated as Superfund sites like the Captain Jack Mill. Though some of these plans may take many years to implement and will include decades of monitoring, Graves remains positive.

“It’s a finite list and each one that we work through is one less that we have to next year,” Graves said. “We’re getting there one step at a time.”

Of course, pollution from legacy mines is not just a problem in Colorado. The National Association of Abandoned Mine Land Programs, which includes 23 states and three tribes, lists acid mine drainage along with underground mine fires and landslides as major hazards.

Climate change could worsen problem

When Diane McKnight began to research acid mine drainage in 1978, she thought that it was a problem on the verge of a solution.

“It became clear that these are really wicked problems with a lot of challenges,” said McKnight, founding director of the University of Colorado’s Center for Water, Earth Science and Technology and former researcher with the U.S. Geological Survey.

Part of McKnight’s research focuses on how climate change may increase acid mine drainage. She has observed large decreases in stream pH during summer months, which she believes is due in part to rising temperatures. McKnight and other scientists theorize that the intense warming and drying of the soils allow more pyrite to oxidize. As temperatures continue to increase due to climate change, warmer and longer summers could mean more acidic streams.

The Colorado Water Plan, released by the state in 2015, acknowledges that with growing demand for water, ongoing pollution from legacy mines is a water quality concern that needs to be addressed as Colorado faces a possible doubling of its population by 2050.

McKnight is optimistic that advances in science and technology will yield effective options for stream remediation. Just as robotics have been used to explore planets in space, McKnight wonders if they can be utilized for remote cleaning of acid mine drainage, especially in the winter months in Colorado, when avalanches pose threats.

“We can figure this out,” McKnight said. “This is an avenue to meet some of Colorado’s water needs in the future.”


Download media from this story

Photos, video, and the map used in this story, plus additional unpublished, full resolution media, are available in the Captain Jack Mill media gallery page on our website.


Some Western cities offer residents “cash for grass” to reduce irrigation

cash for grass photo

study in 2016 showed that lawns are the largest irrigated crop in America. There are over 40 million grassy acres in the continental U.S., and they take a lot of water to thrive. But in the West, where rainfall is less plentiful, many water providers have been offering rebates to residents willing to tear out turf and replace it with drought tolerant plants. The programs are working and thousands of gallons of water are being saved. So why are two major cities punting on the idea? 

DENVER, Colo. — It’s hard to avoid getting swept up in Wendy Inouye’s enthusiasm when she talks about her garden.

“I love it!” she gushes. “I have so much joy from my garden. Every time I come out I always pause and look at it. You know that saying, take time to smell the roses? I literally do that every single day I come and go from my home.”

Inouye’s front yard at her home in Thornton, Colorado, just north of Denver, is full of “xeric” plants—shrubs and groundcovers adapted to survive in dry climates.

Inouye took out her lawn last summer and replaced it with a Colorado-friendly landscape, including red rock penstemon, hopflower oregano, and a plant called red-birds-in-a-tree. She didn’t want to waste any more water and said the grass in her front yard had no function. It was in full sun and its water needs were astronomical. By taking out 750 square feet of turf and replacing it with a variety of water-saving plants surrounded by rocks and mulch, she and her husband have reduced their water usage from 413 gallons a day to 200.

Pointing to a larger area Inouye said, “This was just one big flat piece of grass that was full of weeds.” She was tired of fighting nature, using pesticides and herbicides. Now she says, she has fun with all her beautiful flowering plants.

cash for grass photo 2

Ditching the “Green Carpet”

It was a lot of work for Inouye to transform her landscape even though she hired contractors to assist with turf removal and changes to her irrigation system. But she got support for her decision from the City of Thornton through a turf removal rebate program that paid her $1.00 for every square foot of turf she took out.

Water conservation and efficiency are important to every utility across the country, and especially in the West where “aridification” is occurring. That’s the term being used in the Colorado River Basin to describe the region’s transition to a water scarce environment due to climate change—a condition that will result in a shrinking supplies.

Water utilities have various strategies to get customers to lower usage. Many offer rebates for installing low-flow toilets and efficient showerheads in older homes to reduce indoor use. With outdoor use, water providers can use “cash-for-grass” incentives as Thornton did for Wendy Inouye. They can also offer free mulch, rebates for efficient irrigation systems, and audits of outside water use.

Recently the Alliance for Water Efficiency (AWE), a non-profit dedicated to efficient and sustainable use of water, produced an assessment concluding that utility-sponsored programs to promote sustainable landscapes save water. Tom Chestnutt, the lead author of AWE’s study, said that turf removal programs have been very successful, and they hit that tipping point causing customers to do something different with their front yards.

The idea of a “green carpet”—lots of grass in front of homes, buildings, and sometimes, even medians—has been described as an aesthetic (inappropriately, many say) imported from the East. In the West, where lawns require irrigation, some water providers see them as out of sync with a western lifestyle.

“Grass? That’s Weird!”

The Metropolitan Water District of Southern California (MWDSC) is the largest water supply district in the United States, serving 19 million customers.

Bill McDonnell, the conservation manager for MWDSC, said that they started asking why do people realistically need to have a 1,500 square-foot rectangle of grass in their front yard that they’re never using? Mowing, fertilizing, adding waste, McDonnell said, “There’s a lot going on there to have a green patch.”

So they started to pay people to take out their lawns.

MWDSC has the largest cash-for-grass program in the country, and its board recently renewed the program increasing the rebate to $2.00 per square foot removed—even though there’s not a current drought emergency.

McDonnell said that when they began turf replacement rebates people went crazy. “People were like, ‘I want this, I don’t want to be watering my lawn; I want a smaller water bill.'”

In Southern California, people irrigate their yards 12 months of the year, and on average, 50 to 60 percent of a home’s use of water is outside. Farther east in the district where it can get really hot, a water bill could easily be based on as much as 70 percent for outdoor use.

In an email, Rebecca Kimitch, who works with McDonnell at MWDSC, said they estimate the water savings from turf removal to be 44 gallons of water annually for every square foot of grass taken out.

McDonnell tells his children that someday they’ll be walking down the street with their kids who will point to a yard with grass and say, “That’s weird.” The whole idea, he says, is to flip it so that the person with grass will be the one who is different.

cash for grass table

Enough Lawn to Wrap Nearly Around the Globe

Southern California is not alone in incentivizing customers to transform their landscapes. Doug Bennett, Conservation Manager for the Southern Nevada Water Authority (SNWA), agrees with McDonnell that having lots of grass serves no functional purpose. The Las Vegas area is the driest metropolitan area in North America, so conservation is always forefront.

SNWA has been running a turf replacement rebate program nearly 20 years and has saved almost 13 billion gallons a year. Bennett said, “There is no room in this city for ‘keep off the grass’ signs,” meaning all grass must be used, not there solely for ornamental or aesthetic purposes.

When asked if SNWA’s program had been successful, Bennett said, “Absolutely. We’re at about 190,000,000 square feet” of turf removed. To illustrate this he said, “That’s enough sod, 18 inches wide to go 95 percent of the way around the world.” But he added that they still have a long way to go having addressed only about half of the non-functional turf in the area.

Turf Removal Rebates—A “Gimmick”?

Given that two of the largest water providers in the drying Southwest region are deploying “cash-for-grass” programs, one might assume that the idea took off in other major cities. And it has—except in two cases—Denver, Colorado, and Phoenix, Arizona.

Phoenix, Arizona, is the country’s fifth largest city, and its water department serves about 1.5 million people. The city doesn’t offer a turf replacement rebate, and Cynthia Campbell, the Water Resource Management Advisor for Phoenix said that even without one, there has been a 30 percent decline in water use overall since about 1980.

Campbell said that in the late 1970s about 80 percent of single-family homes had a majority of their landscaping in turf, but today that number has dropped to about 14 percent.

Even with the decline in turf use, Phoenix homeowners are still using about 60 percent of their water outside their homes. However, Campbell views some conservation rebates as reactive to a special event like the drought in California. Those programs can “take on a gimmick kind of idea,” she said, “unless they can be sustainable for the long haul.” Instead, she thinks that Phoenix is better off trying to educate the public about how to use water in a desert, instead of saying that this year they’re going to pay residents to rip out their grass.

Campbell also noted that the pricing in Phoenix may discourage grass watering, especially during the summer months. A homeowner who wants to water then would be a heavier user and would pay more for it.

But many cities surrounding Phoenix—Glendale, Scottsdale, Mesa, Chandler, Peoria, and Tempe—offer turf replacement rebates.

Glendale, Arizona, is a city of about 240,000. Joanne Toms, its Environmental Program Manager, said they have had a rebate program since 1986. She roughly estimates that an acre of turf converted to desert landscaping saves about a million gallons. Toms said that she would hate to see the rebate program dropped because it shows the city’s leadership and forward-thinking that began in the 1980s. She sees the rebates as an incentive to homeowners who may be on the fence about whether to convert.

Lawns As a “Dispersed Version of a Reservoir”

In comparison to cities in the Southwest, Denver has a semi-arid climate—it gets more precipitation in the spring and summer and has winters—meaning people don’t have to water year-round to maintain a landscape.

A cash-for-grass program would not result in nearly as much water savings as in drier regions. Still, such an incentive could save water. However, Denver Water, the largest provider in Colorado, has decided it’s not a wise use of customers’ money.

Ditch in Time

Jeff Tejral, the manager of water efficiency for Denver Water, says there has already been a lot of change in customers’ landscapes without a turf replacement rebate program. Similar to the city of Phoenix, Tejral attributes the switch to a public education program that Denver Water started in the 1980s.

In addition, Tejral says that Denver Water did an analysis of a cash-for-grass rebate in 2016 and it did not make sense to start one. Tejral’s group calculated the water savings and the cost of the rebates to be $75,000 dollars per acre foot of water conserved, which the agency concluded was not a wise use of its ratepayers’ funds. He said that it would make sense to spend that amount, if they were in dire straits, and a turf rebate were the last option available.

However, there may be another reason that Denver Water doesn’t have a turf removal program—lawns might be a safety net where use could be restricted in extreme drought conditions. At those times of severe need, Denver Water could drastically cut back outdoor usage which would be tolerated more easily than restricting use inside homes. Cutting back lawn watering is much easier to get customers to accept than limiting their shower times or their clothes washings.

This idea was expressed by Colorado University historian Patricia Nelson Limerick in the book she wrote about Denver Water, Ditch in Time: The City, the West and Water. As Limerick writes, Denver water managers see lawns offering a service that is far from evident to most observers. Lawns are devices that receive water that would otherwise bypass Denver unused. She adds that lawns offer a cushion if severe drought should arise, and without that cushion demand would be hardened. “Take out the lawns and water would be directed only to needs that would not be susceptible to restriction.” Limerick writes that to the late Chips Barry, former manager of the Denver Water Department, lawns looked a lot like a dispersed version of a reservoir, holding water that could, in urgent circumstances, be shifted to respond to genuine need.

In response, Tejral said that they are shifting away from viewing turf the way Barry did. He insists there are other benefits to having lawns and landscapes in general, and it’s important to manage landscapes for what is best in the long term for a lot of different purposes, which could include aesthetic. He said that Chips Barry was reflecting on where Denver was, but as it matures as a city and integrates with others, people are going to have to learn the true function of landscapes, which is complicated.

Similar to the municipalities surrounding Phoenix, Front Range municipalities near Denver including Thornton, Centennial Water and Sanitation District (Highlands Ranch), Fort Collins, and Aurora all have rebates for removing grass.

One might think that Tejral would be a big advocate for such an incentive program. Before he worked at Denver Water, Tejral worked at Aurora Water, the water provider for the city of Aurora, just to the east of Denver, and he helped start that utility’s turf rebate program. But, he said, while the two cities are adjacent, Aurora started in a different place than Denver, and the former was more turf-centric. In contrast to Denver, not a lot of people in Aurora were modeling the change to either xeric or more water-efficient landscapes. That led Aurora to start a turf rebate program, in Tejral’s words, “to catch up to what its bigger neighbor Denver had been doing for some time.”

“Smarter Than…Dams, Reservoirs, and Pipelines”

Ten years ago, Drew Beckwith was with Western Resource Advocates, an environmental organization. At that time he told the Boulder Daily Camera, when talking about Denver Water’s plans to expand its water supply in nearby Gross Reservoir, the agency had done a great job with conservation, but what it lacked is what others offer: cash-for-grass incentives.

Beckwith recently moved into the public sector and is now the Water Resources Specialist with another Denver neighbor, the City of Westminster. That municipality plans to offer turf replacement rebates next summer. He said 50 percent of Westminster’s drinking water supplies go to outdoor use, and just like other cities, the water used on grass and plants is highly treated to drinking quality standards, not a cheap process.

According to Beckwith, conservation through cash-for-grass and other incentives, is cheaper, faster, and smarter than building structural projects like dams, reservoirs, and pipelines. He noted there is a cultural shift going on along Colorado’s Front Range moving toward more “Colorado-friendly” landscapes, and Westminster wants to spur that shift.

Meanwhile, back in Thornton, Colorado, Wendy Inouye admires her xeriscape where grass used to be. She said that the rebate she got covered only about a tenth of her conversion expenses. But transforming her landscape gave her the sense that she is doing something for the planet, the community, and herself. And, she added, the rebate made her feel like the city is on the same mission as she is. 

This story originally appeared on H2ORadio.org and is republished here by permission.

The Water Desk’s mission is to increase the volume, depth and power of journalism connected to Western water issues. We’re an initiative of the Center for Environmental Journalism at the University of Colorado Boulder. The Water Desk launched in April 2019 with support from the Walton Family Foundation. We maintain a strict editorial firewall between our funders and our journalism. The Water Desk is seeking additional funding to build and sustain the initiative. Click here to donate.

Does cloud seeding work? Scientists watch ice crystals grow inside clouds to find out

Cloud seeding blizzard photo
A blizzard in Steamboat Springs, Colorado, in 2005. Source: Greg Younger, CC BY-SA

Jeffrey French, University of Wyoming and Sarah Tessendorf, University Corporation for Atmospheric Research

Water is a valuable resource that affects nearly all aspects of life on earth. It also is limited, so people use a variety of methods to ensure that supply meets demand.

One such technique is cloud seeding – adding particles to the atmosphere to promote formation of rain or snow. Today many entities across the West – including state and local goverment agencies, utilities and ski areas – seed clouds in an effort to boost winter snowfall in the mountains. More snowpack means more spring and summer runoff, which feeds local water supplies, irrigates crops and fuels dams that generate hydroelectric power.

Cloud seeding has also been used in efforts to disperse fog at airports, boost summer rainfall and reduce hail. In fact, cloud seeding occurs in more than 50 countries worldwide. Yet despite all of this activity, we still don’t know whether it works.

We are atmospheric scientists and recently conducted a field study to evaluate cloud seeding as a means of enhancing mountain snowpack from winter storms. Our results clearly demonstrate that, at least under certain conditions, it is possible to change the evolution and growth of cloud particles, leading to snowfall that otherwise would not have occurred. The next question is whether cloud seeding can be an effective tool for water managers in the western United States.

Snow cover in Sierra Nevada
Snow cover in California’s Sierra Nevada mountains in an average snowfall year versus a drought year. Snowpack is an important water source for western states. Source: NASA/Modis

Creating crystals inside clouds

Clouds are made up of water droplets that are too small to fall as precipitation. These droplets often supercool to temperatures well below the freezing point – as low as 0 degrees Fahrenheit (minus 18 degrees Celsius) or colder. In many circumstances ice crystals (which can grow rapidly in the presence of supercooled liquid) must be present for a cloud to produce any significant amount of precipitation. For clouds that form as air is lifted over a mountain, if no ice crystals or too few of them are present, many of the water droplets that make up the cloud simply evaporate on the downwind side of the mountain.

Winter cloud seeding is based on a hypothesis that when supercooled water exists in a cloud, it can be modified by introducing particles that act as artificial ice nuclei. This process creates ice crystals that will utilize the supercooled water to grow large enough that they eventually fall to the surface as snow.

Cloud seeding was pioneered by atmospheric scientist Bernard Vonnegut, brother of famed novelist Kurt Vonnegut. In 1947 Vonnegut’s lab showed that silver iodide was an effective ice nucleus that could form ice at temperatures much warmer than naturally occurring ice nuclei.

Over the next 40 years, scientists studying cloud seeding made significant discoveries about nearly all aspects of cloud physics. Despite this, in 2003 the National Research Council concluded that “there still is no convincing scientific proof of the efficacy of intentional weather modification efforts.” Nonetheless, states and communities pressed on with operational cloud seeding, while research on its effectiveness ground to a halt.

How snow forms, and sometimes becomes hail or sleet.

The path to SNOWIE

Why do these programs exist without scientific evidence that they work? The answer is simple: Western states need water, and many decision-makers believe that cloud seeding can be a cost-effective way to produce it.

In 2004 the state of Wyoming commissioned a pilot project, which came to the same conclusion as many previous studies: Cloud seeding might have increased precipitation, but the increase could also be explained by natural variability in storm systems. However, a sister project funded by the National Science Foundation demonstrated that new computer modeling tools and improved instrumentation could produce some new insights.

Meanwhile, Idaho Power Company was working with the National Center for Atmospheric Research to evaluate the company’s ongoing operational cloud seeding program. From this collaboration came the idea to use new computer modeling tools and improved instrumentation to assess the effectiveness of Idaho Power’s cloud seeding program. The ultimate result was our project, Seeded and Natural Orographic Wintertime clouds: the Idaho Experiment, or SNOWIE.

From silver iodide to snow

In the winter of 2017, we set out armed with sophisticated radars, such as the Doppler on Wheels (DOWs), which we positioned at mountaintop locations, and the Wyoming Cloud Radar (WCR), which we mounted on a research aircraft. These tools enabled us to peer into clouds in order to determine where and when precipitation was developing.

cloud seeding research plane
Research aircraft with wingtip imaging probes. Source: Jeffrey French, CC BY-ND

After clouds were seeded with silver iodide particles, we used imaging probes that hung from the wings of research aircraft to examine fine details of cloud particles as the plane passed in and out of the seeded regions. Just two weeks into our 10-week field project, our radar detected the first undeniable signal of precipitation resulting from cloud seeding.

We saw clear and unambiguous signals that releasing silver iodide particles was initiating ice crystal formation, and that these crystals were growing into snow and falling to the mountain’s surface. Inside areas affected by seeding, the ice crystal concentrations increased by the hundreds leading to the formation of snow. In contrast, just 1 kilometer away in nonseeded cloud regions the cloud remained composed mostly of small liquid droplets and largely devoid of ice.

How could we tell that what we saw was actually due to cloud seeding? In one case, an aircraft passed back and forth along a straight track that was perpendicular to the wind direction, releasing silver iodide. The silver iodide began to disperse downwind through the cloud in a zig-zag plume – a pattern that was created by the aircraft’s flight pattern and would not have occurred naturally. We saw radar echoes forming in a zig-zag pattern that matched our prediction based on when and where the silver iodide was released in the clouds.

Can cloud seeding make a difference?

Now that we know cloud seeding can lead to snowfall, we want to see whether it can change the balance of water over an entire mountain range. Data from SNOWIE will be used in computer models to test our ideas of how cloud seeding might influence seasonal snowfall and quantify its impact. Ultimately, water managers and public officials will want to know how much additional precipitation can be produced because of cloud seeding, and whether it is a cost-effective way to augment precipitation in local watersheds.

Robert M. Rauber of the University of Illinois, Katja Friedrich of the University of Colorado, Bart Geerts of the University of Wyoming, Roy Rasmussen and Lulin Xue of the National Center for Atmospheric Research, and Mel Kunkel and Derek Blestrud of Idaho Power Company also participated in the SNOWIE study discussed in this article.

Jeffrey French, Assistant Professor of Atmospheric Science, University of Wyoming and Sarah Tessendorf, Project Scientist, University Corporation for Atmospheric Research

This article is republished from The Conversation under a Creative Commons license. Read the original article.

Recent stories